Despite a notably stronger risk sentiment on Monday, the US dollar remained resilient. It was surprising to see the New Zealand dollar at the bottom of the currency list, especially on a day when the S&P 500 surged by over 1%. This suggests that the market is grappling with mixed forces.
With little significant economic data and no updates from the Fed, the focus shifted to analyzing Federal Reserve options and gearing up for today’s US Presidential debate. Bonds initially fell but staged a sharp recovery later in the day. Risk-sensitive currencies, including commodity-linked dollars, remained weak after breaking below last week’s lows.
The EUR/USD pair joined the downward move late in the session as part of a broader USD recovery. Meanwhile, USD/JPY held firm at August’s spike lows, bouncing off the 142.00 level for the second consecutive day, climbing nearly 2 cents, hinting that the market may be waiting for the FOMC meeting or another catalyst to break the current range. Despite this, crude oil benefitted from the overall bullish risk environment, with US WTI prices still hovering just below the $70 mark.
Today’s Market Expectations
The UK Labour Market report is the main event of the day and it is expected to show 114K new jobs added in the three months to July, an increase from 97K in June, with the unemployment rate projected to drop to 4.1% from 4.2%. Average Earnings including Bonus are forecasted to rise to 4.1%, while Average Earnings excluding Bonus are expected to be 5.1%, slightly down from the previous year’s 5.4%. Market sentiment points to an 83% probability of no rate change at the next BoE meeting, with a total of 43 basis points of easing predicted by year-end.
In the US, the NFIB Small Business Optimism Index is forecasted at 93.6, marginally down from 93.7 in the previous reading. Though a quiet week in terms of data, the market’s focus on growth makes this report significant. The NFIB index recently broke out of its range since 2022, reaching a new cycle high of 93.6, potentially signaling a key shift in business sentiment.
We had a good start to the week yesterday, with markets being slow and quite trendy, as the USD continued to extend Friday’s gains, so the forex moves were predictable. We opened 9 trading signals, six of which closed by the end of the day. Five were winning forex signals, and just one losing trade in Dow.
Gold Holds Above the 20 Daily SMA
Gold reached a record high of $1,531.60 in early August, but despite several attempts, buyers have yet to surpass this level. Last week saw another effort, but it failed following the release of the US Non-Farm Payrolls (NFP) data. XAU/USD briefly peaked at $2,529 during the NFP volatility, only to reverse and form a “bearish engulfing” candlestick pattern, signaling potential for further declines. Despite a drop in US Treasury yields, Gold prices also fell, but the 20-day SMA remains a key support level, with gold returning and closing above this moving average once again yesterday. Although the long-term trend remains bullish, short-term weaknesses are becoming evident.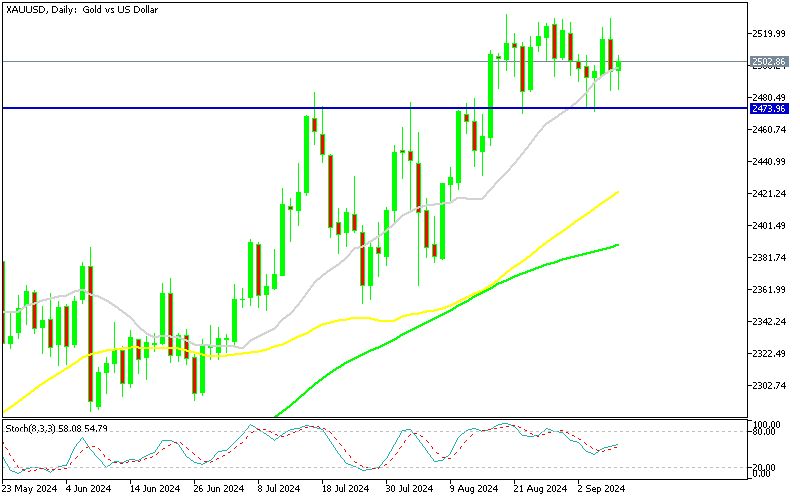
XAU/USD – Daily chart
Bearish Signal After the Lower High in GBP/USD
The EUR/USD pair dropped 2 cents in the last week of August, but found solid support slightly above 1.10, aided by the 20-day SMA. Buyers stepped in to drive the pair higher, attempting to restart the bullish trend. However, the rally faded after a 1-cent gain, and the price dipped again post-NFP data, creating a lower high, which could signal the beginning of a bearish trend. Sellers will need to push the price below the 20-day moving average and the key 1.10 level to confirm this.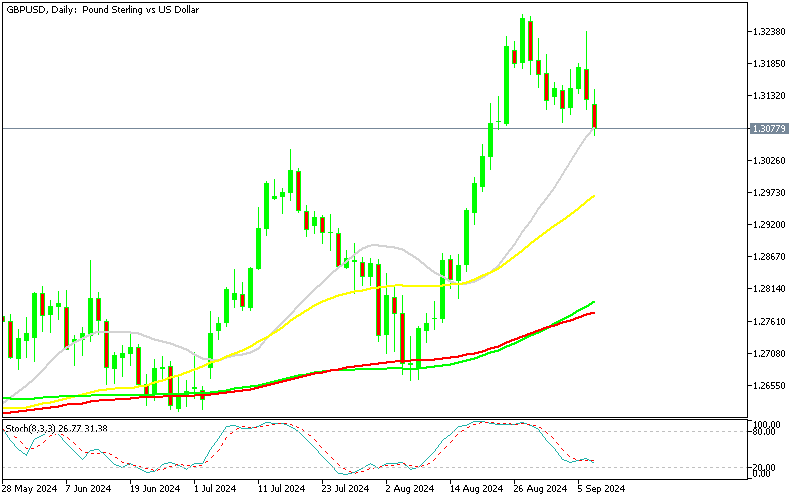
GBP/USD – Daily Chart
Cryptocurrency Update
Bitcoin testing the Resistance at $57,000 Again

BTC/USD – Daily chart
Ethereum Bounces Off the Support
Ethereum, meanwhile, has been in a downtrend since March, characterized by a series of lower highs, suggesting more declines. After a sharp drop from $3,830 to below $3,000, Ethereum saw a brief rally in June, surpassing the 50-day SMA. However, persistent selling pressure drove the price down to the $2,200 level. Support held firm, and the price has since rebounded with three consecutive bullish daily candlesticks, indicating some renewed buying interest.
ETH/USD – Daily chart